 Business wire
- The national home price gain was 3.4% year over year in December 2024, down from the 5.6% growth recorded in the final month of 2023.
- Home prices are projected to rise by 4.1% annually by December 2025.
- Northeastern states again showed strong annual price appreciation in December.
CoreLogic: Home Price Growth Ticks up Slightly in December
Media Contact:
Robin Wachner
newsmedia@corelogic.com
CoreLogic®, a leading global property information, analytics and data-enabled solutions provider, today released the CoreLogic Home Price Index (HPI™) and HPI Forecast™ for December 2024.
d="news-body-cta">This press release features multimedia. View the full release here: https://www.businesswire.com/news/home/20250206991392/en/
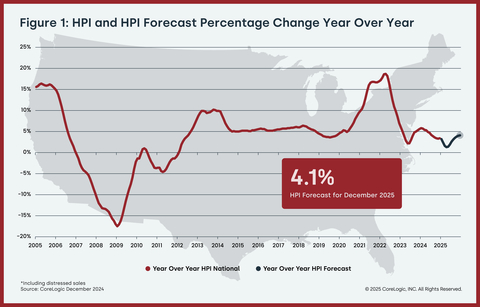
Figure 1: HPI & HPI Forecast % Change YoY (Graphic: Business Wire)
U.S. home price gains showed a slight marginal uptick to 3.4% year over year in December, though the uptick mos

tly reflects weak 2023 year-end. Otherwise, home price appreciation has been almost flat since the typically busy fall selling season began in September. Although housing supply improved throughout most of 2024, conditions trended down in December, and the country still needs more inventory for supply to catch up with buyer demand. The tariffs that the Trump administration is threatening to enact are expected to increase building costs for both new homes and rebuilding those damaged by January’s incredibly destructive wildfires in Los Angeles County, costs that will delay home construction times and inevitably get passed on to the buyer or owner. Editor’s note: As of Feb. 3, the tariffs on Mexico and Canada have been delayed for at least a month.
“Home prices have remained flat since the housing market began seeing slower activity this past summer. Bifurcation across markets has also persisted. Northeastern markets drove appreciation growth due to low inventories of homes for sale, while Southern markets readjusted to higher inventories and increases in variable mortgage costs, such as taxes and insurance. Home prices are also cooling in the markets in Mountain West, which have been trying to find stability over the last year following the surge in mortgage rates and price declines from pandemic highs. Despite the difficult housing markets conditions in 2024, home prices increased about 4.5% over the course of the year, a small jump compared to the 4.1% uptick in 2023. Going forward, with inventories slowing improving and mortgage rates remaining elevated, forecasts suggest a smaller overall increase in prices in 2025.”
Top Takeaways:
- U.S. single-family home prices (including distressed sales) increased by 3.4% year over year in December 2024 compared with December 2023. On a month-over-month basis, home prices were flat compared with November 2024.
- In December, the annual appreciation of detached properties (3.7%) was 2 percentage points higher than that of attached properties (1.7%).
- CoreLogic’s forecast shows annual U.S. home price gains increasing to 4.1% in December 2025.
- Chicago posted the highest year-over-year home price increase of the country's 10 tracked metro areas in November, at 5.6%. Las Vegas saw the next-highest gain at 5%.
- Among states, Connecticut ranked first for annual appreciation in November (up by 7.8%), followed by New Jersey (up by 7.7%) and New Hampshire (up by 7.3%). One state and one district recorded year-over-year home price losses.
The next CoreLogic HPI press release, featuring January 2025 data, is scheduled to be issued on March 4, 2025, at 8 a.m. EST.
Methodology
The CoreLogic HPI™ is built on industry-leading public record, servicing and securities real-estate databases and incorporates more than 45 years of repeat-sales transactions for analyzing home price trends. Generally released on the first Tuesday of each month with an average five-week lag, the CoreLogic HPI is designed to provide an early indication of home price trends by market segment and for the Single-Family Combined tier, representing the most comprehensive set of properties, including all sales for single-family attached and single-family detached properties. The indices are fully revised with each release and employ techniques to signal turning points sooner. The CoreLogic HPI provides measures for multiple market segments, referred to as tiers, based on property type, price, time between sales, loan type (conforming vs. non-conforming) and distressed sales. Broad national coverage is available from the national level down to ZIP Code, including non-disclosure states.
CoreLogic HPI Forecasts™ are based on a two-stage, error-correction econometric model that combines the equilibrium home price—as a function of real disposable income per capita—with short-run fluctuations caused by market momentum, mean-reversion, and exogenous economic shocks like changes in the unemployment rate. With a 30-year forecast horizon, CoreLogic HPI Forecasts project CoreLogic HPI levels for two tiers — Single-Family Combined (both attached and detached) and Single-Family Combined Excluding Distressed Sales. As a companion to the CoreLogic HPI Forecasts, Stress-Testing Scenarios align with Comprehensive Capital Analysis and Review (CCAR) national scenarios to project five years of home prices under baseline, adverse and severely adverse scenarios at state, metropolitan areas and ZIP Code levels. The forecast accuracy represents a 95% statistical confidence interval with a +/- 2% margin of error for the index.
About Market Risk Indicators
Market Risk Indicators are a subscription-based analytics solution that provide monthly updates on the overall health of housing markets across the country. CoreLogic data scientists combine world-class analytics with detailed economic and housing data to help determine the likelihood of a housing bubble burst in 392 major metros and all 50 states. Market Risk Indicators is a multi-phase regression model that provides a probability score (from 1 to 100) on the likelihood of two scenarios per metro: a >10% price reduction and a ? 10% price reduction. The higher the score, the higher the risk of a price reduction.
About the Market Condition Indicators
As part of the CoreLogic HPI and HPI Forecasts offerings, Market Condition Indicators are available for all metropolitan areas and identify individual markets as overvalued, at value or undervalued. These indicators are derived from the long-term fundamental values, which are a function of real disposable income per capita. Markets are labeled as overvalued if the current home price indexes exceed their long-term values by greater than 10% and undervalued where the long-term values exceed the index levels by greater than 10%.
Source: CoreLogic
The data provided are for use only by the primary recipient or the primary recipient's publication or broadcast. This data may not be resold, republished or licensed to any other source, including publications and sources owned by the primary recipient's parent company without prior written permission from CoreLogic. Any CoreLogic data used for publication or broadcast, in whole or in part, must be sourced as coming from CoreLogic, a data and analytics company. For use with broadcast or web content, the citation must directly accompany first reference of the data. If the data are illustrated with maps, charts, graphs or other visual elements, the CoreLogic logo must be included on screen or website. For questions, analysis or interpretation of the data, contact Robin Wachner at newsmedia@corelogic.com. For sales inquiries, visit https://www.corelogic.com/support/sales-contact/. Data provided may not be modified without the prior written permission of CoreLogic. Do not use the data in any unlawful manner. The data are compiled from public records, contributory databases and proprietary analytics, and its accuracy is dependent upon these sources.
About CoreLogic
CoreLogic is a leading provider of property insights and innovative solutions, working to transform the property industry by putting people first. Using its network, scale, connectivity and technology, CoreLogic delivers faster, smarter, more human-centered experiences that build better relationships, strengthen businesses and ultimately create a more resilient society. For more information, please visit www.corelogic.com.
CORELOGIC, the CoreLogic logo, CoreLogic HPI and CoreLogic HPI Forecast are trademarks of CoreLogic, Inc. and/or its subsidiaries. All other trademarks are the property of their respective owners.
View source version on businesswire.com: https://www.businesswire.com/news/home/20250206991392/en/


Add Comment